May 28, 2015
Table of Contents
Summary
Section 1 - Admissions to Segregation
Section 2 - Average Length of Stay in Segregation
Section 3 - Self-Injury
Section 4 - Flow-Through Population of Offenders and Segregation
Section 5 - Current Incarcerated Population comparing certain Characteristics
Section 6 - Principal Domain from the Correctional Plan
Section 7 - Transfer History to Treatment Centres
The data in this report was extracted from the CSC / PBC Data Warehouse as of the year-end cut-off date of 2015-04-19.
Summary
Populations
Between March 31, 2005 and March 31, 2015 the overall CSC incarcerated population increased by 13.6% (from 12,623 to 14,335). During the same period women increased 77.4% (from 368 to 653), men 11.6% (from 12,255 to 13,682), Aboriginal offenders 52.4% (from 2,296 to 3,500), non-Aboriginal offenders 4.9% (from 10,327 to 10,835), Black offenders 77.5% (from 792 to 1,406) while Caucasian offenders decreased -6.1% (from 8,815 to 8,281). The Caucasian group is the only group showing a steadily declining population.
The number of admissions to segregation has grown at a slower rate than for the equivalent CSC incarcerated population of Federally Sentenced Women ( FSW ), male, Aboriginal, non-Aboriginal and Caucasian inmates. However, Black segregation admissions have grown at a faster rate than the incarcerated population of Black offenders.
Length of Stay
The average length of stay in segregation has decreased from 40 days in 2005-2006 to 27 days in 2014- 2015. In the same period the FSW length of stay decreased from 15 to 8 days, Blacks from 36 to 27 days, Caucasians from 38 to 26 days and Aboriginals from 45 to 28 days. Aboriginal offenders have consistently had the longest average length of stay in segregation of any of these groups.
Self-Injury and Attempted Suicide
Of the current incarcerated population of 14,517, 6.7% have a history of self-injuring (11.7% for FSW and 9.1% for Aboriginal). Of the 659 offenders currently in segregation, 13.7% have a history of self-injury (22.2% for FSW and 16.9% for Aboriginal).
Of the 967 with a history of self-injury, 86.6% also have a history of segregation compared to a rate of 48.1% in the general population who have not self-injured.
Flow-Through Populations
When comparing the number of offenders who were incarcerated for at least one day in a penitentiary during the 2014-2015 fiscal year with the number who were admitted to segregation at least once during the same year it is apparent that over 26% of all male offenders are admitted to segregation at least once during the fiscal year compared to over 46% of women.
These ratios change to one third of all Aboriginal offenders as compared to one quarter for non- Aboriginals.
Characteristics of the Current Incarcerated Population by those with and without a History of being Segregated
Of the current incarcerated population of 14,517, males were more likely to have a history of segregation than females (48.5% compared to 39.1%) and Aboriginals were more likely than non- Aboriginals to have been segregated (55.9% compared to 45.6%).
Offenders who have a history of segregation are more likely to be assessed with a high risk (75.5% vs. 45.5%), high needs (74.4% vs. 47.5%), low motivation (27.2% vs. 11.2%), low reintegration potential (62.3% vs. 24.5%) and low accountability (30.3% vs. 17.9%).
Correctional Plan Principal Domains for those with and without a History of Segregation
Of the current incarcerated population of 14,517 who have both a history of being segregated and who also have issues identified related to their Correctional Plan principal domain areas, those with a history of segregation are more likely to have behavioural issues than those with a history of segregation and no behavioural issues (68.6% vs. 44.9%), issues with cognitive thinking (68.8% vs. 45.3%), identified as requiring interventions (64.9% vs. 47.5%), have mental health issues (63.2% vs. 48.0%), have issues with mental abilities (61.6% vs. 47.8%) and have sexual behaviour issues (54.0% vs. 48.0%).
History of being in Segregation Correlated with Transfers into Regional Treatment Centres
Of the 6,982 currently incarcerated population who have a history of being segregated, 20.7% of these offenders also have a history of being in a treatment centre. For FSW offenders the ratio is 16.9% and for Aboriginal offenders 26.1%.
Of the 2,111 currently incarcerated offenders who have been in a treatment centre, 68.3% have also been in segregation. For FSW offenders the ratio is 78.9% and for Aboriginal offenders 72.9%.
Section 1 – Admissions to Segregation
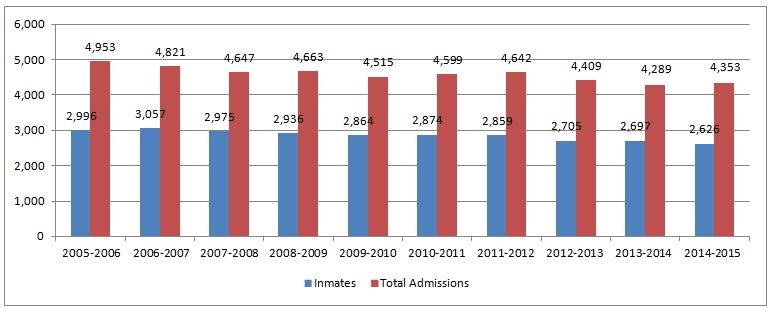
The following graphs and tables show information related to the total number of segregation admissions within a fiscal year and the number of individual inmates involved in those admissions. While all admissions to segregation are shown, an individual offender will be counted once per fiscal year irrespective of their total number of admissions. Voluntary and involuntary segregation have been aggregated whereas disciplinary segregation is not included in this report. For comparative purposes please refer to Table 2 which shows a snapshot of the CSC incarcerated population on March 31st from 2005 to 2015 by male, female, Aboriginal, non-Aboriginal, Black and Caucasian.
Graph 1: Total Admissions to Segregation – 10 Years
This graph combines voluntary segregation admissions and involuntary segregation admissions. Shown in the graph are the total admissions in red and the number of individual inmates in blue.
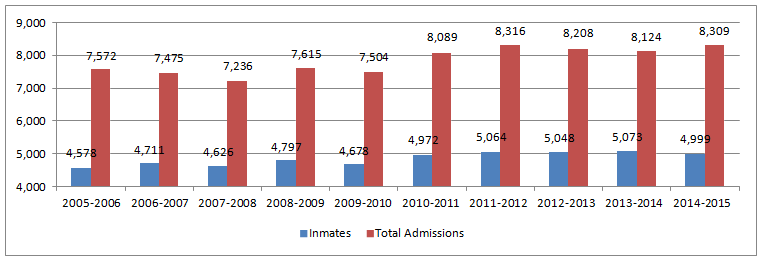
- The number of admissions and offenders have fluctuated but with a generally upward trend.
Graph 2: Total FSW Admissions to Segregation – 10 Years
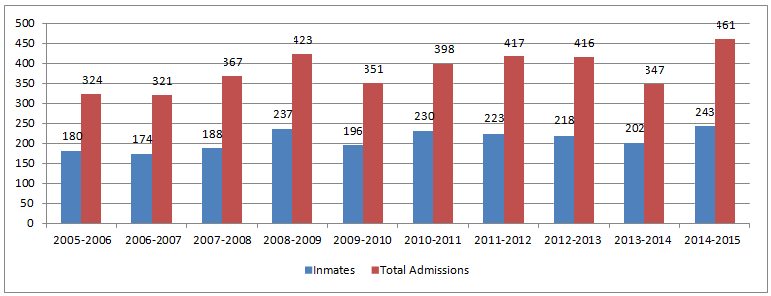
- The number of FSW admissions to segregation and offenders has fluctuated.
- 2014-2015 saw the highest number of FSW admissions and offenders for the last 10 years.
Graph 3: Total Aboriginal Admissions to Segregation – 10 Years
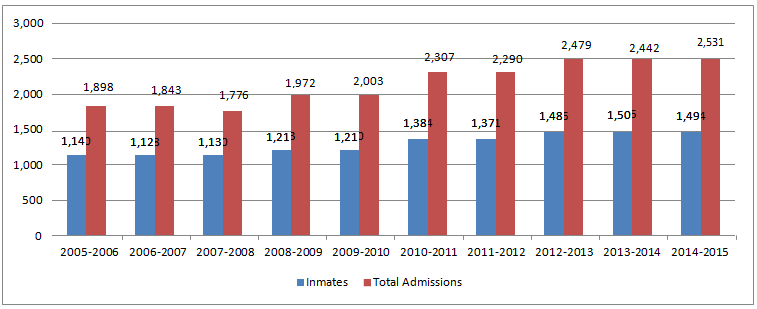
- The number of Aboriginal admissions to segregation and offenders has increased most years.
Graph 4: Total Black Admissions to Segregation – 10 Years
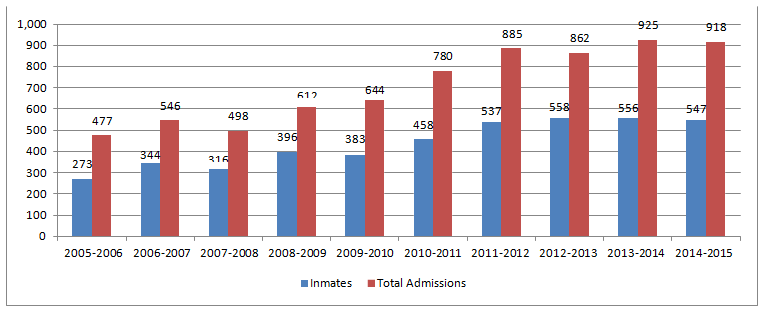
- Both the number of Black offender admissions to segregation and the number of offenders have increased significantly in the last 10 years.
Graph 5: Total Caucasian Admissions to Segregation – 10 Years
- The number of Caucasian offender admissions to segregation and the number of offenders have both decreased in the last 10 years.
| 2005-2006 | 2006-2007 | 2007-2008 | 2008-2009 | 2009-2010 | 2010-2011 | 2011-2012 | 2012-2013 | 2013-2014 | 2014-2015 | |
|---|---|---|---|---|---|---|---|---|---|---|
| Total | 1.7 | 1.6 | 1.6 | 1.6 | 1.6 | 1.6 | 1.6 | 1.6 | 1.6 | 1.7 |
| FSW | 1.8 | 1.9 | 2.0 | 1.8 | 1.8 | 1.7 | 1.9 | 1.9 | 1.7 | 1.9 |
| Aboriginal | 1.7 | 1.6 | 1.6 | 1.6 | 1.7 | 1.7 | 1.7 | 1.7 | 1.6 | 1.7 |
| Black | 1.8 | 1.6 | 1.6 | 1.5 | 1.7 | 1.8 | 1.7 | 1.6 | 1.7 | 1.7 |
| Caucasian | 1.7 | 1.6 | 1.6 | 1.6 | 1.6 | 1.6 | 1.7 | 1.7 | 1.6 | 1.7 |
- FSW have the highest average number of admissions to segregation per individual offender.
Table 2: Population Snapshots of the CSC Incarcerated Population compared to Growth in Segregation Admissions between 2005-2006 and 2014-2015
The percentage growth in the segregation admissions can be determined by comparing the number of segregation admissions in 2005-2006 with the admissions in 2014-2015 as shown in Graphs 1 to 5.
| Male | Female | Total Population | Aboriginal | Non-Aboriginal | Black | Caucasian | |
|---|---|---|---|---|---|---|---|
| March 31 2005 | 12,255 | 368 | 12,623 | 2,296 | 10,327 | 792 | 8,815 |
| March 31 2006 | 12,263 | 408 | 12,671 | 2,373 | 10,298 | 809 | 8,702 |
| March 31 2007 | 12,695 | 476 | 13,171 | 2,580 | 10,591 | 889 | 8,848 |
| March 31 2008 | 13,061 | 490 | 13,551 | 2,653 | 10,898 | 990 | 8,913 |
| March 31 2009 | 12,786 | 501 | 13,287 | 2,617 | 10,670 | 1,065 | 8,613 |
| March 31 2010 | 13,028 | 503 | 13,531 | 2,793 | 10,738 | 1,144 | 8,563 |
| March 31 2011 | 13,652 | 570 | 14,222 | 3,058 | 11,164 | 1,297 | 8,681 |
| March 31 2012 | 13,817 | 603 | 14,420 | 3,171 | 11,249 | 1,340 | 8,531 |
| March 31 2013 | 14,166 | 579 | 14,745 | 3,388 | 11,357 | 1,446 | 8,613 |
| March 31 2014 | 14,213 | 614 | 14,827 | 3,385 | 11,442 | 1,449 | 8,560 |
| March 31 2015 | 13,682 | 653 | 14,335 | 3,500 | 10,835 | 1,406 | 8,214 |
| Growth | 1,427 | 285 | 1,712 | 1,204 | 508 | 614 | -601 |
| % Growth | 11.6% | 77.4% | 13.6% | 52.4% | 4.9% | 77.5% | -6.8% |
| % Segregation Growth | 8.1% | 35.0% | 9.2% | 31.1% | 1.9% | 100.4% | -12.3% |
- The incarcerated female population has increased 77.4% since March 31, 2005 whereas the male population increased only 11.6%.
- The incarcerated Aboriginal population has increased 52.4% since March 31, 2005 whereas the non-Aboriginal population increased only 4.9%.
- The Black population has increased by 77.5% since March 31, 2005 whereas the Caucasian population decreased 6.8%.
- The incarcerated female population has grown at a rate over twice that of the number of segregation admissions (77.4% compared to 35%)
- The incarcerated Black population has grown at a rate lower than that of the number of segregation admissions (77.5% compared to 100.4%)
- The male, Aboriginal, non-Aboriginal and Caucasian admissions to segregation have grown at a rate lower than the growth in their incarcerated populations.
Section 2 – Average Length of Stay in Segregation
This section shows the average length of stay in segregation. The length of stay is calculated based on the number of days from the date of admission to segregation and the date of release. Offenders who have not yet been released from segregation are not included in these calculations.
Graph 6: Average Length of Stay in Segregation – All Offenders and FSW
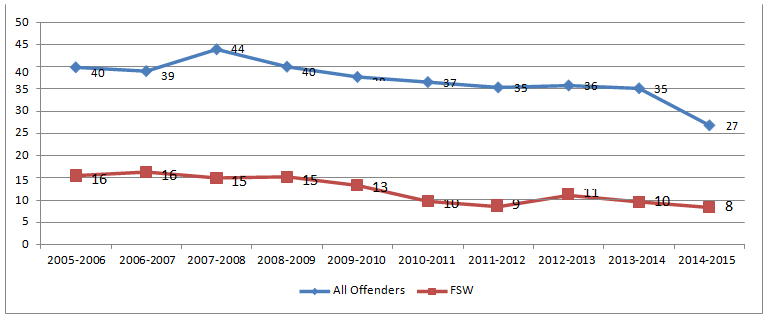
- FSW offenders remain in segregation for significantly shorter periods than the average for all offenders.
- The average length of stay in segregation has decreased for all offenders and for FSW .
Graph 7: Average Length of Stay in Segregation – Aboriginal, Black and Caucasian Offenders
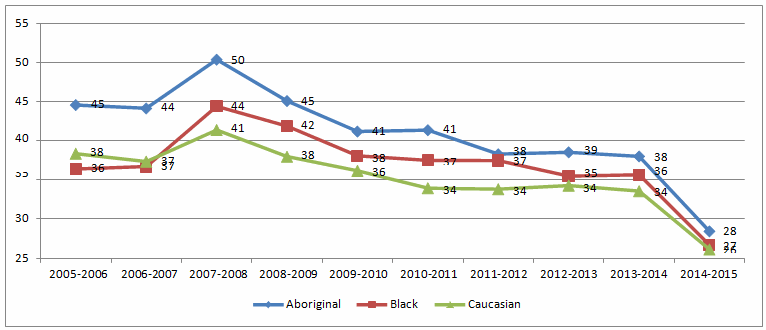
- The average length of stay in segregation has decreased for these three racial groups
- Aboriginal offenders consistently have an average length of stay in segregation that is greater than for Black or Caucasian offenders.
Section 3 – Self-Injury
The following tables show the offenders who were admitted to segregation during 2013-2014 comparing those with a history of self-injury compared to those with no such history. In order to do this all self-injury and attempted suicide incidents since 1985-86 were extracted and then compared to those offenders admitted to segregation in 2013-2014. The most current fiscal year was not used because many of those admitted in 2014-2015 have not yet been released.
Male compared to Female Offenders
| History of Self-Injury | ||||
|---|---|---|---|---|
| Yes | No | Total | % | |
| Female | 63 | 139 | 202 | 31.2% |
| Male | 622 | 4,249 | 4,871 | 12.8% |
| Total | 685 | 4,249 | 5,073 | 13.5% |
- Female offenders who were admitted to segregation in 2013-2014 were much more likely than males to have a history of self-injury (31.2% compared to 12.8%).
| History of Self-Injury | |||
|---|---|---|---|
| Yes | No | Total | |
| Female | 11 | 8 | 9 |
| Male | 38 | 33 | 34 |
| Total | 35 | 32 | 33 |
- Female offenders spend much less time in segregation than a male offender whether or not they had a history of self-injury or not.
Table 5: Total Number of Self-Injury Incidents in which Male and Female Offenders admitted to Segregation in 2013-2014 were involved with since 1985-86.
This table shows the total number of historical self-injury incidents comparing the gender of the offenders. An offender who was involved in multiple self-injury incidents will be counted each time for purposes of this table.
| Total Injury Incidents | % | |
|---|---|---|
| Female | 1,511 | 37% |
| Male | 2,604 | 63% |
| Total | 4,115 |
- The 63 female offenders admitted to segregation (Table 3) in 2013-2014 who had a history of self-injury were involved with 1,511 incidents of self-injury or 37% of the total for this group when comparing gender.
- Female offenders admitted to segregation in 2013-2014 had been involved with a total of 24 incidents of self-injury on average.
- For male offenders the average number of self-injury incidents was just over 4.
Aboriginal compared to Non-Aboriginal Offenders
| History of Self-Injury | ||||
|---|---|---|---|---|
| Yes | No | Total | % | |
| Aboriginal | 260 | 1,245 | 1,505 | 17.3% |
| Non-Aboriginal | 425 | 3,139 | 3,564 | 11.9% |
| Total | 685 | 4,388 | 5,073 | 13.5% |
- Aboriginal offenders who were admitted to segregation in 2013-2014 were more likely than non-Aboriginals to have a history of self-injury (17.3% compared to 11.9%).
| History of Self-Injury | |||
|---|---|---|---|
| Yes | No | Total | |
| Aboriginal | 34 | 36 | 36 |
| Non-Aboriginal | 36 | 31 | 31 |
| Total | 35 | 32 | 33 |
- Overall, Aboriginal offenders spend several days longer in segregation than non-Aboriginal offender.
Table 8: Total Number of Self-Injury Incidents in which Aboriginal and non-Aboriginal Offenders admitted to Segregation in 2013-2014 were involved since 1985-86.
This table shows the total number of historical self-injury incidents comparing Aboriginal with non-Aboriginal offenders. An offender who was involved in multiple self-injury incidents will be counted each time for purposes of this table.
| Total Injury Incidents | % | |
|---|---|---|
| Aboriginal | 1,879 | 46% |
| Non-Aboriginal | 2,236 | 54% |
| Total | 4,115 |
- The 260 Aboriginal offenders admitted to segregation in 2013-2014 (Table 6) who had a history of self-injury were involved with 1,879 incidents of self-injury or 46% of the total for this group when comparing race.
- Aboriginal offenders admitted to segregation in 2013-2014 had been involved with a total of 7 incidents of self-injury on average.
- For non-Aboriginal offenders the average number of self-injury incidents was just over 5.
Black compared to Caucasian Offenders
The following three tables compare Black with Caucasian Offenders. All other racial groups have been excluded.
| History of Self-Injury | ||||
|---|---|---|---|---|
| Yes | No | Total | % | |
| Black | 36 | 520 | 556 | 6.5% |
| Caucasian | 372 | 2,325 | 2,697 | 13.8% |
| Total | 408 | 2,845 | 3,253 | 12.5% |
- Black offenders who were admitted to segregation in 2013-2014 were less likely than Caucasians to have a history of self-injury (6.5% compared to 13.8%).
| History of Self-Injury | |||
|---|---|---|---|
| Yes | No | Total | |
| Black | 37 | 30 | 31 |
| Caucasian | 37 | 30 | 31 |
| Total | 37 | 30 | 31 |
- There was no difference in the days spent in segregation for these two racial groups
Table 11: Total Number of Self-Injury Incidents in which Black and Caucasian Offenders admitted to Segregation in 2013-2014 were involved with since 1985-86.
This table shows the total number of historical self-injury incidents comparing Black with Caucasian offenders. An offender who was involved in multiple self-injury incidents will be counted each time for purposes of this table.
| Total Injury Incidents | % | |
|---|---|---|
| Black | 104 | 5% |
| Caucasian | 2,105 | 95% |
| Total | 2,209 |
- The 36 Black offenders admitted to segregation in 2013-2014 (Table 9) who had a history of self- injury were involved with 104 incidents of self-injury or 5% of the total for this group when comparing Black with Caucasian offenders.
- Black offenders admitted to segregation in 2013-2014 had been involved with a total of 3 incidents of self-injury on average.
- For Caucasian offenders the average number of self-injury incidents was almost 6.
Table 12: Total Current Incarcerated Population with and without a History of Self-Injury and with and without a History of Segregation
This table and the two that follow show the current incarcerated population of 14,517 offenders and separates them into those who have a history of self-injury or not and those who have a history of segregation or not.
| Self-Injury History | No Incidents | Total | % History of Self-Injury | |
|---|---|---|---|---|
| No Segregation History | 130 | 7,405 | 7,535 | 1.7% |
| History of Segregation | 837 | 6,145 | 6,982 | 12.0% |
| Total | 967 | 13,550 | 14,517 | 6.7% |
| % History of Segregation | 86.6% | 45.4% | 48.1% |
- Of the total incarcerated population 6.7% have a history of self-injury. The rate increases to 12.0% for those who also have a history of segregation and decreases to 1.7% for those with no segregation history.
- Of the 967 with a history of self-injury 86.6% also have a history of segregation.
| Self-Injury History | No Incidents | Total | % History of Self-Injury | |
|---|---|---|---|---|
| No Segregation History | 12 | 403 | 415 | 2.9% |
| History of Segregation | 68 | 199 | 267 | 25.5% |
| Total | 80 | 602 | 682 | 11.7% |
| % History of Segregation | 85.0% | 33.1% | 39.1% |
- Of the total incarcerated FSW population 11.7% have a history of self-injury. The rate increases to 25.5% for those who also have a history of segregation and decrease to 2.9% for those with no segregation history.
- Of the 80 with a history of self-injury 85.0% also have a history of segregation.
| Self-Injury History | No Incidents | Total | % History of Self-Injury | |
|---|---|---|---|---|
| No Segregation History | 37 | 1,519 | 1,556 | 2.4% |
| History of Segregation | 286 | 1,690 | 1,976 | 14.5% |
| Total | 323 | 3,209 | 3,532 | 9.1% |
| % History of Segregation | 88.5% | 52.7% | 55.9% |
- Of the total incarcerated Aboriginal population 9.1% have a history of self-injury. The rate increases to 14.5% for those who also have a history of segregation and decrease to 2.4% for those with no segregation history.
- Of the 323 with a history of self-injury 88.5% also have a history of segregation.
Section 4 -Flow-Through Population of Offenders and Segregation
The following tables show the flow-through population for CSC compared to the flow-through population of those who were placed in segregation. The flow-through counts each offender once who spent at least one day in a federal penitentiary during the fiscal year no matter how many times that the offender may have been admitted and released or the number of days that the offender might have been in custody during the year.
| Total Flow-Through | 2009-2010 | 2010-2011 | 2011-2012 | 2012-2013 | 2013-2014 | 2014-2015 |
|---|---|---|---|---|---|---|
| Male | 19,080 | 19,324 | 19,513 | 19,829 | 20,166 | 19,556 |
| Female | 903 | 909 | 981 | 936 | 943 | 995 |
| Total | 19,983 | 20,233 | 20,494 | 20,765 | 21,109 | 20,551 |
| Segregation Flow-Through | 2009-2010 | 2010-2011 | 2011-2012 | 2012-2013 | 2013-2014 | 2014-2015 |
|---|---|---|---|---|---|---|
| Male | 4,810 | 5,136 | 5,214 | 5,205 | 5,293 | 5,145 |
| Female | 351 | 398 | 417 | 416 | 347 | 461 |
| Total | 5,161 | 5,534 | 5,631 | 5,621 | 5,640 | 5,606 |
| % of Population | 2009-2010 | 2010-2011 | 2011-2012 | 2012-2013 | 2013-2014 | 2014-2015 |
|---|---|---|---|---|---|---|
| Male | 25.2% | 26.6% | 26.7% | 26.2% | 26.2% | 26.3% |
| Female | 38.9% | 43.8% | 42.5% | 44.4% | 36.8% | 46.3% |
| Total | 25.8% | 27.4% | 27.5% | 27.1% | 26.7% | 27.3% |
- Approximately one quarter of male offenders who are incarcerated during a fiscal year spend some time in segregation.
- Over 40% of female offenders who are incarcerated during a fiscal year spend some time in segregation.
| Total Flow-Through | 2009-2010 | 2010-2011 | 2011-2012 | 2012-2013 | 2013-2014 | 2014-2015 |
|---|---|---|---|---|---|---|
| Aboriginal | 4,125 | 4,220 | 4,460 | 4,784 | 4,843 | 4,967 |
| Non-Aboriginal | 15858 | 16013 | 16034 | 15981 | 16266 | 15584 |
| All Races | 19,983 | 20,233 | 20,494 | 20,765 | 21,109 | 20,551 |
| Segregation Flow-Through | 2009-2010 | 2010-2011 | 2011-2012 | 2012-2013 | 2013-2014 | 2014-2015 |
|---|---|---|---|---|---|---|
| Aboriginal | 1,349 | 1,573 | 1,533 | 1,686 | 1,686 | 1,689 |
| Non-Aboriginal | 3,812 | 3,961 | 4,098 | 3,935 | 3,954 | 3,917 |
| All Races | 5,161 | 5,534 | 5,631 | 5,621 | 5,640 | 5,606 |
| % of Population | 2009-2010 | 2010-2011 | 2011-2012 | 2012-2013 | 2013-2014 | 2014-2015 |
|---|---|---|---|---|---|---|
| Aboriginal | 32.7% | 37.3% | 34.4% | 35.2% | 34.8% | 34.0% |
| Non-Aboriginal | 24.0% | 24.7% | 25.6% | 24.6% | 24.3% | 25.1% |
| All Races | 25.8% | 27.4% | 27.5% | 27.1% | 26.7% | 27.3% |
- Approximately one quarter of non-Aboriginal offenders who are incarcerated during a fiscal year spend some time in segregation.
- Approximately one third of Aboriginal offenders who are incarcerated during a fiscal year spend some time in segregation.
Section 5 - Current Incarcerated Population comparing certain Characteristics
The following tables and graphs compare various characteristics of the active offender population with a current status of “incarcerated” that have a history of having been in segregation at some time versus those with no history. The population of “incarcerated” showed 14,517 and these offenders have been compared based on race, gender, risk, need, motivation level, reintegration potential and accountability level.
Table 17: Incarcerated Comparing Gender and Segregation History
This table divides the “incarcerated” status offenders by gender showing those who have no history of ever being segregated and those who have a history of segregation.
| History of Segregation | ||||
|---|---|---|---|---|
| No History | Previously Segregated | Total | % | |
| Female | 415 | 267 | 682 | 39.1% |
| Male | 7,120 | 6,715 | 13,835 | 48.5% |
| Total | 7,535 | 6,982 | 14,517 | 48.1% |
- Of the 14,517 offenders who had a status of “incarcerated” 48.1% had a history of having been in segregation at some time.
- A higher proportion of male offenders than female offenders have a history of segregation (48.5% compared to 39.1%).
Table 18: Incarcerated Comparing Race and Segregation History
This table divides the “incarcerated” status offenders by Aboriginal and non-Aboriginal showing those who have no history of ever being segregated and those who have a history of segregation.
| History of Segregation | ||||
|---|---|---|---|---|
| No History | Previously Segregated | Total | % | |
| Aboriginal | 1,556 | 1,976 | 3,532 | 55.9% |
| Non-Aboriginal | 5,979 | 5,006 | 10,985 | 45.6% |
| Total | 7,535 | 6,982 | 14,517 | 48.1% |
- Aboriginal offenders are somewhat more likely to have been in segregation than non-Aboriginal offenders (55.9% compared to 45.6%).
Graph 8: Incarcerated Population comparing Segregation History with no Segregation History by Risk Level
This graph shows the proportion of the current incarcerated population with high, medium or low risk by those with a history of segregation and those with no history.
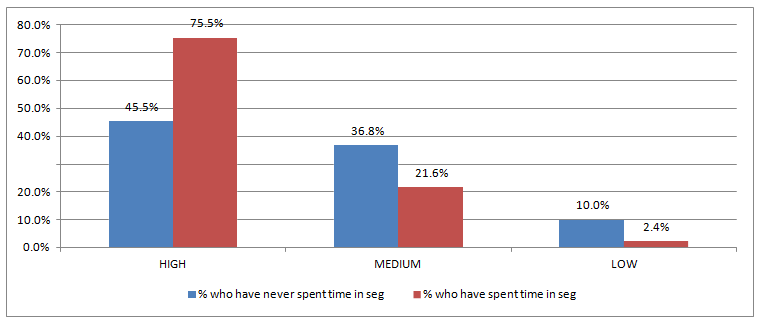
- Offenders with a history of segregation are more likely to be rated as high risk than those with no history (75.5% compared to 45.5%)
Graph 9: Incarcerated Population comparing Segregation History with no Segregation History by Need Level
This graph shows the proportion of the current incarcerated population with high, medium or low need by those with a history of segregation and those with no history.
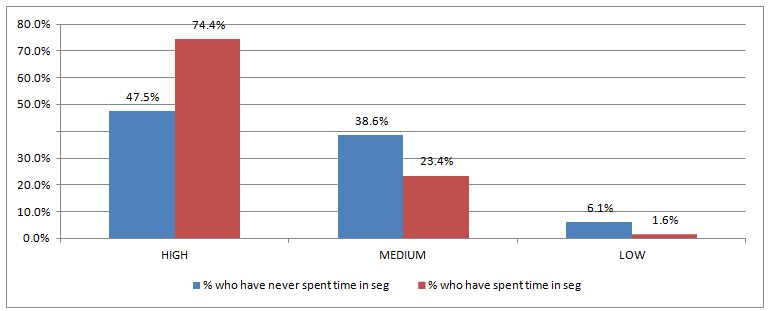
- Offenders with a history of segregation are more likely to be rated as high need than those with no history (74.4% compared to 47.5%)
Graph 10: Incarcerated Population comparing Segregation History with no Segregation History by Motivation Level
This graph shows the proportion of the current incarcerated population with high, medium or low motivation by those with a history of segregation and those with no history.
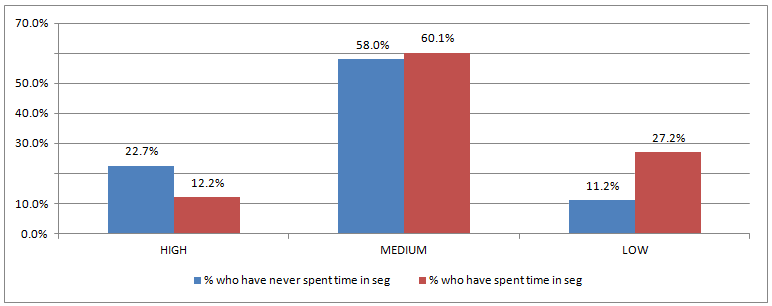
- Offenders with a history of segregation are more likely to be rated as having low motivation than those with no history (27.2% compared to 11.2%)
Graph 11: Incarcerated Population comparing Segregation History with no Segregation History by Reintegration Potential
This graph shows the proportion of the current incarcerated population with high, medium or low reintegration potential by those with a history of segregation and those with no history.
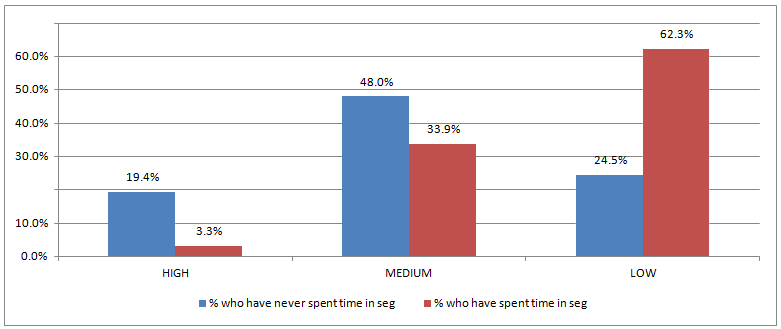
- Offenders with a history of segregation are much more likely to be rated as having low reintegration potential than those with no history (62.3% compared to 24.5%)
Graph 12: Incarcerated Population comparing Segregation History with no Segregation History by Accountability Level
This graph shows the proportion of the current incarcerated population with high, medium or low accountability levels by those with a history of segregation and those with no history.
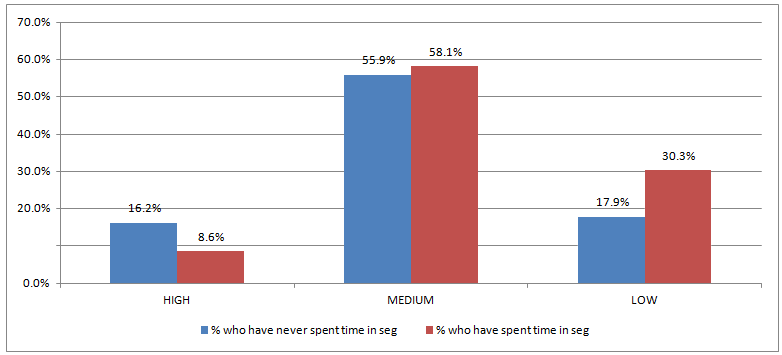
- Offenders with a history of segregation are more likely to be rated as having low accountability level than those with no history (30.3% compared to 17.9%)
Section 6 - Principal Domain from the Correctional Plan
The following graphs show results related to offenders who have been identified as having issues related to the “principal domains” as identified in their Correctional Plans. The principal domains below include “behavioural”, “cognition”, “interventions”, “mental health”, “mental ability”, “self-concept” and “sexual behaviour”. In order to create these graphs the current population of offenders with a current status of “incarcerated” was selected (14,517) and then their current Correctional Plans were compared to identify which offenders had been identified as having issues related to the principal domains identified above and those with no issues. Following this, this population was further sub-divided by those with or without a history of segregation.
Graph 13: Offenders with a Principal Domain of Behavioural by those with and without a History of Segregation
This graph shows the proportion of offenders who have been identified in their Correctional plans as having “behavioural” issues and those with no “behavioural” issues comparing those who have a history of segregation with those with no history of segregation.
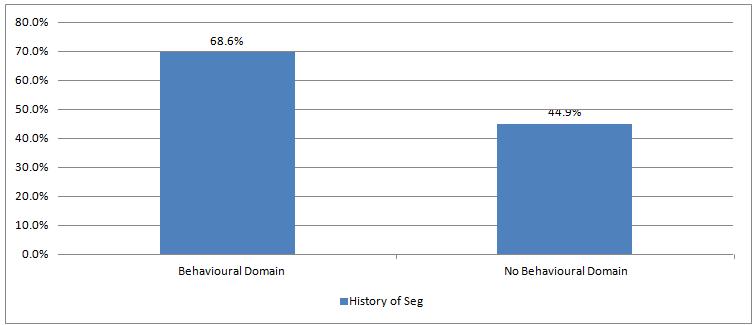
- Offenders who have been identified in their Correctional Plans as having behavioural issues are much more likely to have a history of being segregated than those who have been identified as having no behavioural issues (68.6% compared to 44.9%)
Graph 14: Offenders with a Principal Domain of Cognition by those with and without a History of Segregation
This graph shows the proportion of offenders who have been identified in their Correctional plans as having “cognitive” issues and those with no “cognitive” issues comparing those who have a history of segregation with those with no history of segregation.

- Offenders who have been identified in their Correctional Plans as having cognitive issues are much more likely to have a history of being segregated than those who have been identified as having no cognitive issues (68.8% compared to 45.3%).
Graph 15: Offenders with a Principal Domain of Interventions by those with and without a History of Segregation
This graph shows the proportion of offenders who have been identified in their Correctional plans as requiring “interventions” and those not requiring “interventions” comparing those who have a history of segregation with those with no history of segregation.
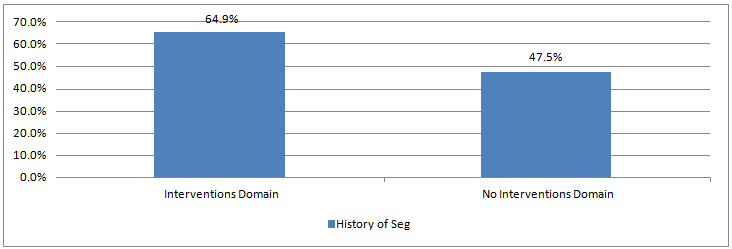
- Offenders who have been identified in their Correctional Plans as having interventions issues are much more likely to have a history of being segregated than those who have been identified as having no interventions issues (64.9% compared to 47.5%).
Graph 16: Offenders with a Principal Domain of Mental Health by those with and without a History of Segregation
This graph shows the proportion of offenders who have been identified in their Correctional plans as having “mental health” issues and those with no “mental health” issues comparing those who have a history of segregation with those with no history of segregation.

- Offenders who have been identified in their Correctional Plans as having mental health issues are much more likely to have a history of being segregated than those who have been identified as having no mental health issues (63.2% compared to 48.0%).
Graph 17: Offenders with a Principal Domain of Mental Ability by those with and without a History of Segregation
This graph shows the proportion of offenders who have been identified in their Correctional plans as having “mental ability” issues and those with no “mental ability” issues comparing those who have a history of segregation with those with no history of segregation.

- Offenders who have been identified in their Correctional Plans as having mental ability issues are much more likely to have a history of being segregated than those who have been identified as having no mental ability issues (61.6% compared to 47.8%).
Graph 18: Offenders with a Principal Domain of Sexual Behaviour by those with and without a History of Segregation
This graph shows the proportion of offenders who have been identified in their Correctional plans as having “sexual behaviour” issues and those with no “sexual behaviour” issues comparing those who have a history of segregation with those with no history of segregation.

- Offenders who have been identified in their Correctional Plans as having sexual behaviour issues are more likely to have a history of being segregated than those who have been identified as having no sexual behaviour issues (54.0% compared to 48.0%).
Section 7 – Transfer History to Treatment Centres
This section shows the current incarcerated population, 14,517 by the number who have a history of being segregated or not and whether these offenders also have any record of ever having been transferred into a regional treatment centre. An offender can have multiple transfers into a treatment centre but this offender will be counted only once in the following tables.
| No RTC Transfers | Transfer to RTC Recorded | Total | % Transfer to RTC Recorded | |
|---|---|---|---|---|
| No Segregation History | 6,866 | 669 | 7,535 | 8.9% |
| History of Segregation | 5,540 | 1,442 | 6,982 | 20.7% |
| Total | 12,406 | 2,111 | 14,517 | 14.5% |
| % History of Segregation | 44.7% | 68.3% | 48.1% |
- Of the 2,111 currently incarcerated offenders who have a history of being in an RTC 68.3% of these also have a history of being in segregation.
- Of the 6,982 currently incarcerated offenders who have a history of being in segregation 20.7% of these also have a history of being in an RTC.
| No RTC Transfers | Transfer to RTC Recorded | Total | % Transfer to RTC Recorded | |
|---|---|---|---|---|
| No Segregation History | 403 | 12 | 415 | 2.9% |
| History of Segregation | 222 | 45 | 267 | 16.9% |
| Total | 625 | 57 | 682 | 8.4% |
| % History of Segregation | 35.5% | 78.9% | 39.1% |
- Of the 57 currently incarcerated FSW offenders who have a history of being in an RTC 78.9% of these also have a history of being in segregation.
- Of the 267 currently incarcerated FSW offenders who have a history of being in segregation 16.9% of these also have a history of being in an RTC.
| No RTC Transfers | Transfer to RTC Recorded | Total | % Transfer to RTC Recorded | |
|---|---|---|---|---|
| No Segregation History | 1,361 | 195 | 1,556 | 12.5% |
| History of Segregation | 1,461 | 515 | 1,976 | 26.1% |
| Total | 2,822 | 710 | 3,532 | 20.1% |
| % History of Segregation | 51.8% | 72.5% | 55.9% |
- Of the 710 currently incarcerated Aboriginal offenders who have a history of being in an RTC 72.5% of these also have a history of being in segregation.
- Of the 1,976 currently incarcerated Aboriginal offenders who have a history of being in segregation 20.1% of these also have a history of being in an RTC.
Date modified
2015-05-28

